
在这个例子中,我们将收集带有collectd的系统统计信息,并将它们传递给InfluxDB,然后存储它们。然后我们将使用Grafana可视化存储的数据。我们将使用collectD版本5.5.1,InfluxDB版本1.3.5和Grafana版本4.4.3。
我假设你已经安装了InfluxDB和Grafana。如果您想知道如何安装它们,可以参考之前文章InfluxDB和Grafana集成。
系统设置
如下图所示,我们设置两个虚拟机。
- 服务器1(192.168.50.20) - 收集统计数据并通过collectd转移到InfluxDB。
- 服务器2(192.168.99.30) - 其中统计数据(stats)由InfluxDB存储并由Grafana可视化。
服务器1信息
服务器1必须能够通过UDP端口与服务器2通信,25826是collectd将用于传输数据内容的端口。检查通信是否正常。如果它确实有效,你应该看到类似下面的内容。
server1:~$ sudo tcpdump -i eth0 -p -n dst port 25826
tcpdump: verbose output suppressed, use -v or -vv for full protocol decode
listening on eth0, link-type EN10MB (Ethernet), capture size 65535 bytes
10:52:34.138885 IP 10.0.2.15.34237 > 192.168.99.30.25826: UDP, length 1297
10:52:44.137505 IP 10.0.2.15.34237 > 192.168.99.30.25826: UDP, length 1319
10:52:54.138522 IP 10.0.2.15.34237 > 192.168.99.30.25826: UDP, length 1301
10:53:04.137666 IP 10.0.2.15.34237 > 192.168.99.30.25826: UDP, length 1298
InfluxDB
我们首先需要准备InfluxDB才能与collectd进行交互,所以请执行以下操作。
用户认证
执行以下操作以防止对数据库进行未经身份验证的访问。我们将创建一个管理员用户,并且只允许管理员用户使用用户名和密码访问数据库。
server-2:~$ influx
Connected to http://localhost:8086 version 1.3.5
InfluxDB shell version: 1.3.5
>
> CREATE USER inanzzz WITH PASSWORD '123123' WITH ALL PRIVILEGES
>
> SHOW USERS
user    admin
----    -----
inanzzz true
>
> EXIT
auth-enabled在/etc/influxdb/influxdb.conf配置文件中查找并将其设置为auth-enabled = true启用身份验证。
重启服务
server-2:〜$ sudo service Influxdb restart
创建数据库
server-2:~$ curl -i -XPOST http://localhost:8086/query -u inanzzz:123123 --data-urlencode "q=CREATE DATABASE collectd"
验证数据库
server-2:~$ influx -username inanzzz -password 123123
Connected to http://localhost:8086 version 1.3.5
InfluxDB shell version: 1.3.5
>
> SHOW DATABASES
name: databases
name
----
_internal
collectd
>
配置collectd
[[collectd]]在/etc/influxdb/influxdb.conf文件中查找并使其与下面的设置匹配。
[[collectd]]
  enabled = true
  bind-address =“:25826”
  database =“collectd”
  retention-policy =“”
  typesdb =“/ usr / local / share / collectd / type.db”
  batch-size = 5000
  batch- pending = 10
  batch-timeout =“10s”
  read-buffer = 0
下载types.db
server-2:~$ sudo mkdir /usr/local/share/collectd
server-2:~$ sudo wget -P /usr/local/share/collectd https://raw.githubusercontent.com/collectd/collectd/master/src/types.db
重启InfluxDB
server-2:〜$ sudo service Influxdb stop
server-2:〜$ sudo service Influxdb start
CollectD
信息
CollectD用于定期收集系统指标,并可以将它们发送到数据存储,例如InfluxDB等。默认情况下,collectd监视CPU,内存,接口,负载和其他一些,但您可以将其配置为使用相关监视任何您想要监视的内容插件。
安装
server-1:〜$ sudo apt-get update
server-1:〜$ sudo apt-get install collectd collectd-utils
server-1:〜$ sudo service collectd status
配置
默认情况下,启用了许多插件,但我们只会观察cpu,磁盘,负载,内存,进程,交换和用户统计信息,然后禁用剩余的插件。
注意:禁用插件时,请确保禁用相关代码块(如果有)。例如df,rrdtool需要禁用。
server-1:~$ sudo nano /etc/collectd/collectd.conf

# Enable just these
LoadPlugin cpu
LoadPlugin disk
LoadPlugin load
LoadPlugin memory
LoadPlugin processes
LoadPlugin swap
LoadPlugin users
除此之外,启用LoadPlugin network然后将下面的块添加到页面底部。
<Plugin "network">
    Server "192.168.99.30" "25826"
</Plugin>
重启collectd
server-1:~$ sudo service influxdb restart
InfluxDB
我们来看看我们在collectd数据库中的含义。
server-2:~$ influx -username inanzzz -password 123123
Connected to http://localhost:8086 version 1.3.5
InfluxDB shell version: 1.3.5
>
> USE collectd
Using database collectd
>
> SHOW MEASUREMENTS
name: measurements
name
----
cpu_value
memory_value
>
>
> SELECT * FROM cpu_value LIMIT 5
name: cpu_value
time                host  instance type type_instance value
----                ----  -------- ---- ------------- -----
1504974634305158622 other 0        cpu  user          2711
1504974634305164974 other 0        cpu  nice          0
1504974634305167452 other 0        cpu  system        2448
1504974634305167969 other 0        cpu  idle          2227665
1504974634305168533 other 0        cpu  wait          372
>
> SELECT * FROM memory_value LIMIT 5
name: memory_value
time                host  type   type_instance value
----                ----  ----   ------------- -----
1504974634305230505 other memory used          190013440
1504974634305231222 other memory buffered      16171008
1504974634305231662 other memory cached        265412608
1504974634305232101 other memory free          42156032
1504974644301487467 other memory used          188911616
Grafana
浏览http://192.168.99.30:3000并登录admin:admin。
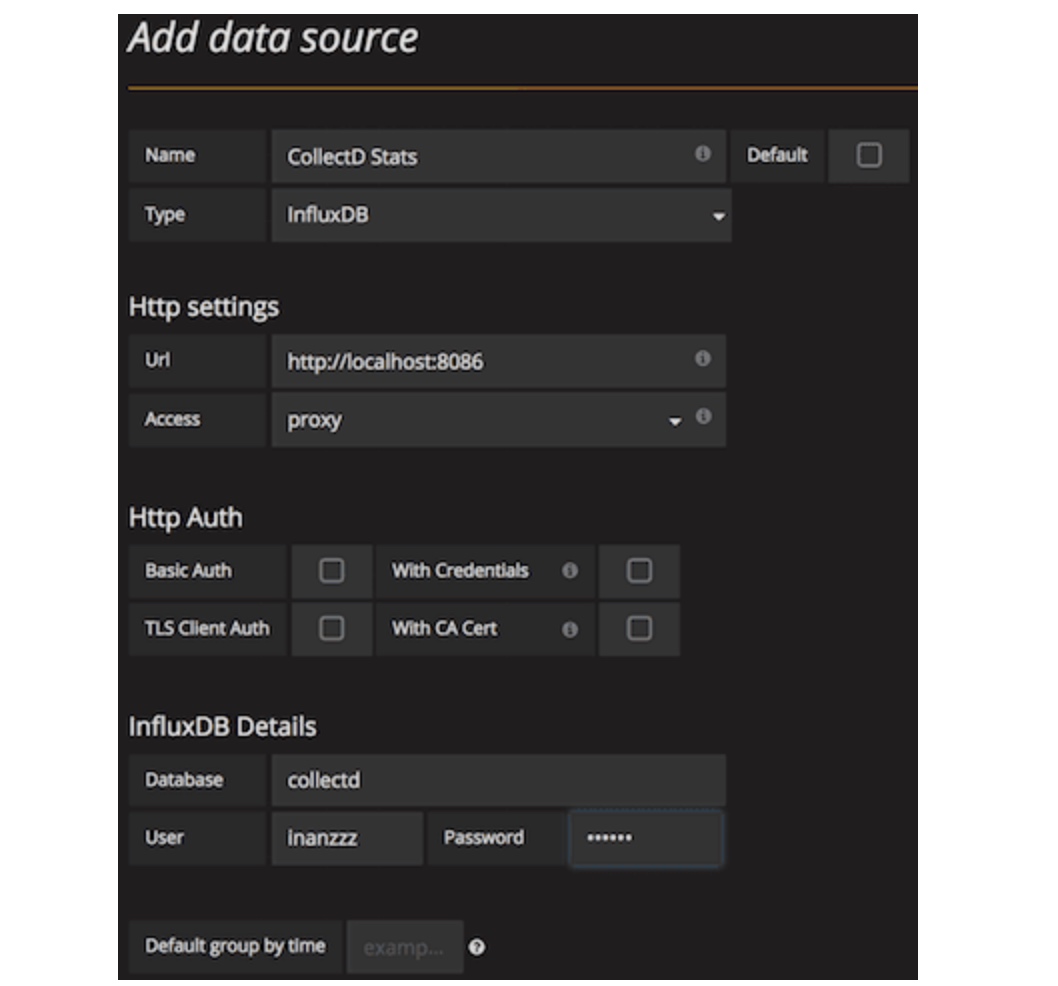
添加数据源
- 单击顶部标题中的Grafana图标,然后选择“数据源”选项。
- 单击页面中的“添加数据源”按钮。
- 如下图所示填写字段,然后单击“添加”按钮。
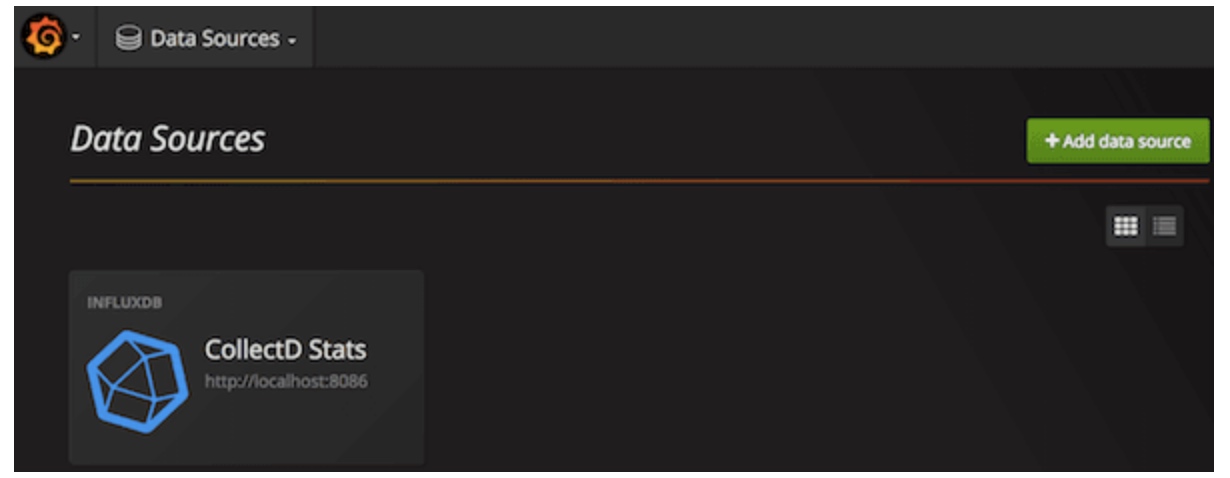
如果单击顶部标题中的Grafana图标并选择“数据源”,则应在下面看到图像。
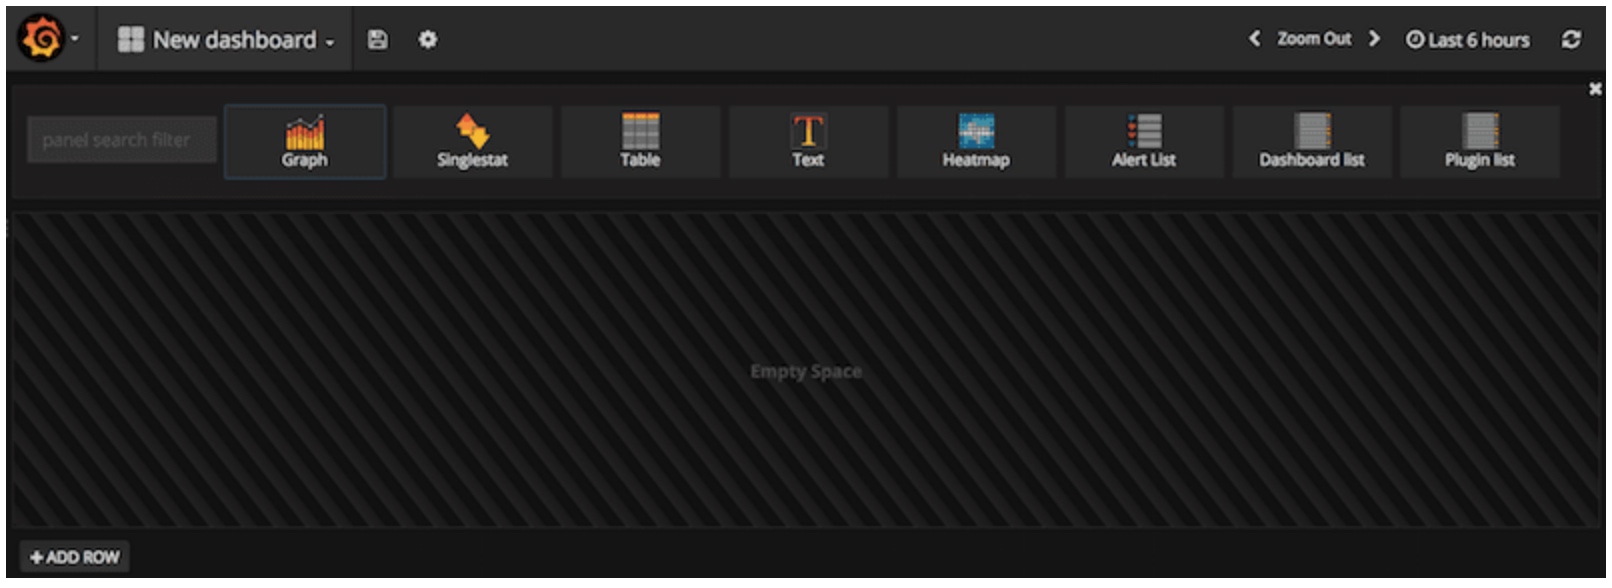
添加仪表板
- 单击顶部标题中的Grafana图标,选择“仪表板”选项,然后选择“新建”。
- 单击页面中的“图形”图标。
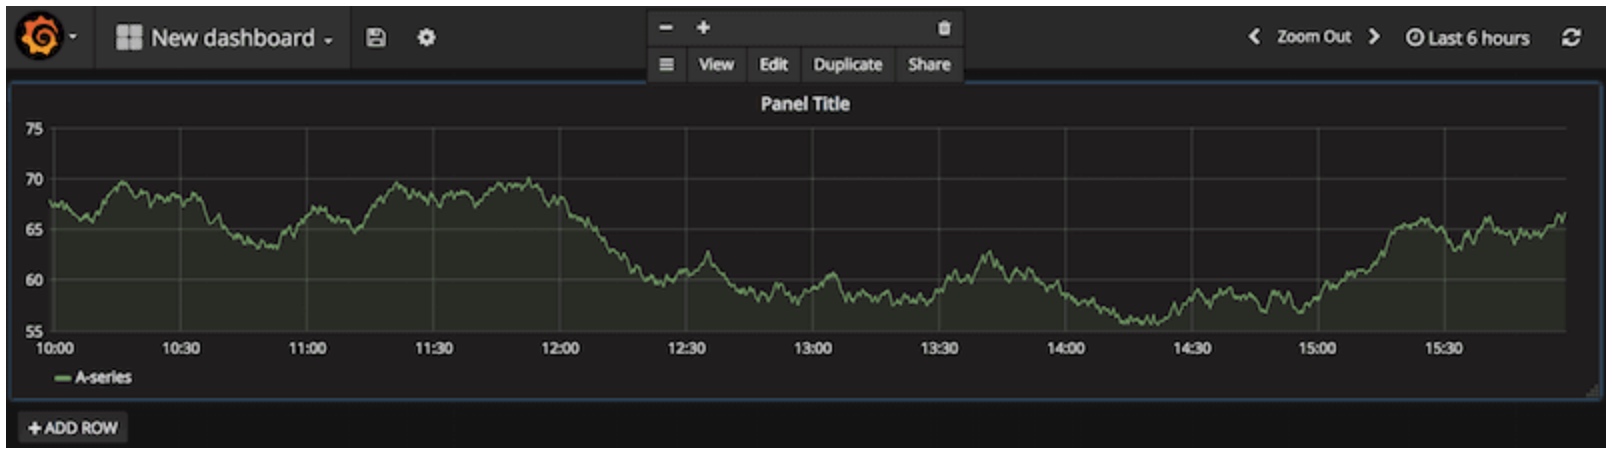
- 单击图形的“面板标题”标题,然后选择“编辑”。
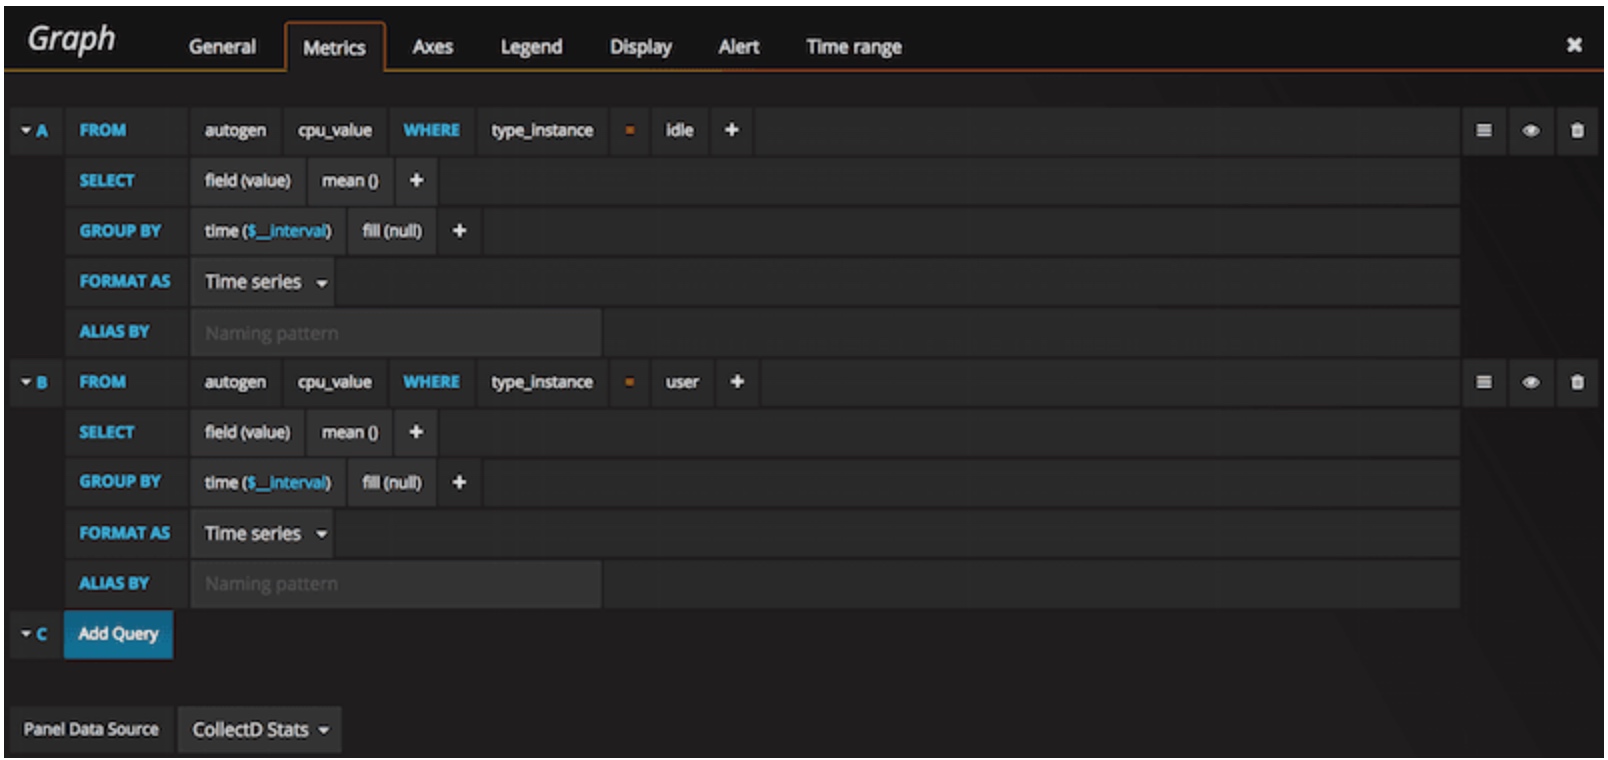
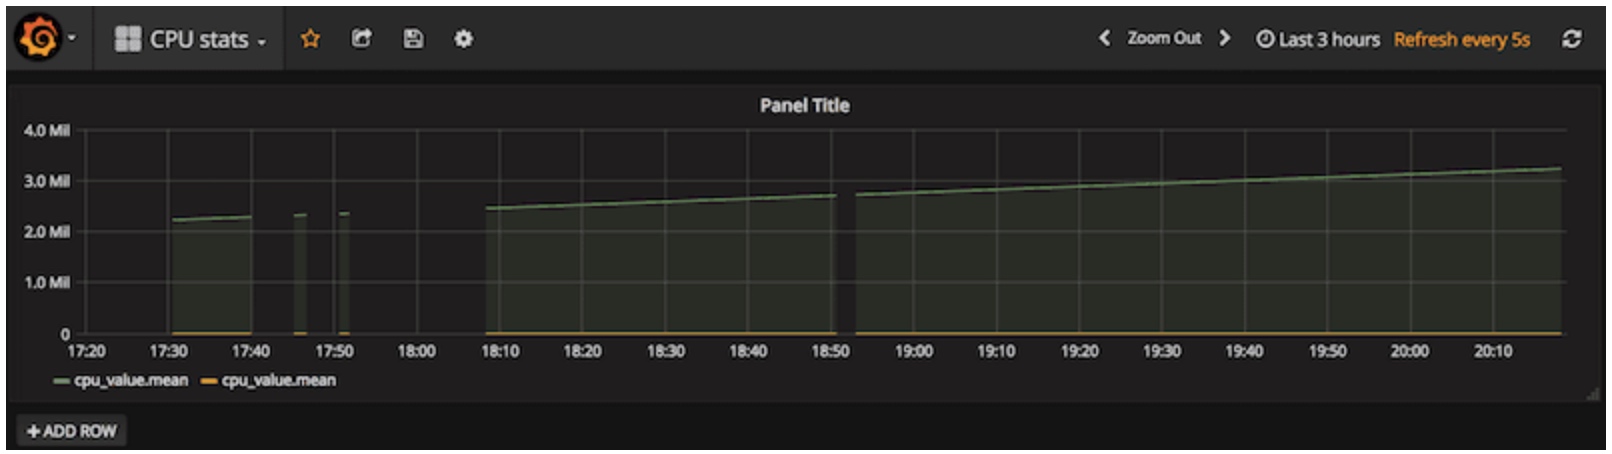
- 配置“指标”如下图所示。
- 单击页面顶部的磁盘图标将其另存为“CPU stats”。这将在下面生成图表。
Collectd参考链接:
英文原文: http://suo.im/4onMlf Centos7的参考:http://suo.im/5egGaw

本文由 空心菜 创作,采用 知识共享署名4.0 国际许可协议进行许可
本站文章除注明转载/出处外,均为本站原创或翻译,转载前请务必署名
最后编辑时间为: Aug 26, 2018 at 12:42 pm