
过去几年我一直在使用Munin作为监控工具。它效果很好,很轻,而且设置起来非常简单。
然而,Munin很老了(它是用Perl写的......说的很多),即使它仍在开发中,你也不会看到像“如何$startup使用Munin来监控他们的基础设施”这样的文章......
无论如何,Munin很棒,我仍然会使用它,但现在可能是时候看看我们在2018年拥有什么样的监控软件了。
现在我们不想让一个软件完成所有工作,而是希望以这种方式分离角色:
- 收集器,您将在要监视的计算机上安装
- 将存储所有测量值的数据库
- 可视化系统,例如网络仪表板
对我来说,3个最受欢迎的技术堆栈似乎是:
- ELK - Elasticsearch - Logstash - Kibana
- PNG - Prometheus - Node Exporter - Grafana
- TIG - Telegraf - InfluxDB - Grafana
但是还有很多其他软件,如Collectd,Grafite,OpenTSDB等。我们通过https://grafana.com/plugins?type=datasource 可以查看Grafana都支持哪些数据来源。
ELK对我们来说太过分了(“E”......),更习惯于处理日志。Prometheus是一个不错的选择,但正如你在标题中看到的那样,我们将在这篇文章中看到如何设置TIG。
起初我很担心,因为我认为所有这些炒作的软件都很难安装,但正如你所看到的,它们实际上非常简单。
TIG技术栈
关于我们的堆栈的更多信息:Telegraf和InfluxDB实际上是由相同的人,InfluxData制作的。他们都是Golang开发的开源软件。InfluxData提供完整的堆栈,其中包含用于显示数据的Chronograf和用于警报的Kapacitor。
由于Grafana是一款非常高质量的软件,也可以发出警报,我选择使用它。它也比Chronograf更先进。如您所见,我们确实有很多可能性!
仅供参考在本博客中根本不会使用Docker,但如果需要,您可以在容器中运行组件。
InfluxDB安装
Debian9安装InfluxDB参考:https://docs.influxdata.com/influxdb/v1.5/introduction/installation/
curl -sL https://repos.influxdata.com/influxdb.key | sudo apt-key add -
echo "deb https://repos.influxdata.com/debian stretch stable" > /etc/apt/sources.list.d/influxdata.list
apt-get update
apt-get install influxdb
systemctl start influxdb
配置InfluxDB
InfluxDB是一个与SQL兼容的时间序列数据库,因此我们可以轻松地设置用户和数据库。您可以使用该influx命令启动其shell 。
root@server ~# influx
Connected to http://localhost:8086 version 1.5.1
InfluxDB shell version: 1.5.1
创建数据库:
> CREATE DATABASE telegraf
> SHOW DATABASES
name: databases
name
----
_internal
telegraf
创建用户。选择一个好的密码,因为InfluxDB将暴露在互联网上。
> CREATE USER telegraf WITH PASSWORD 'superpa$$word'
> GRANT ALL ON telegraf TO telegraf
> SHOW USERS;
user     admin
----     -----
telegraf false
如果您愿意,可以设置保留策略:
> CREATE RETENTION POLICY thirty_days ON telegraf DURATION 30d REPLICATION 1 DEFAULT
> SHOW RETENTION POLICIES ON telegraf
name        duration    replicaN    DEFAULT
DEFAULT     0       1       FALSE
thirty_days 720h0m0s    1       TRUE
Telegraf安装
正如我之前所说,Telegraf和InfluxDB是由同一家公司制作的,因此他们使用相同的APT存储库。
# curl -sL https://repos.influxdata.com/influxdb.key | sudo apt-key add -
# echo "deb https://repos.influxdata.com/debian stretch stable" > /etc/apt/sources.list.d/influxdata.list
# apt-get update
apt install telegraf
systemctl start telegraf
配置Telegraf
备份配置文件:
mv /etc/telegraf/telegraf.conf /etc/telegraf/telegraf.conf.orig
我建议您阅读它,但是这里有一个关于/etc/telegraf/telegraf.conf中可以添加的内容的快速开始。
Agent配置:
[agent]
  hostname = "myserver"
  flush_interval = "15s"
  interval = "15s"
默认情况下,主机名将是服务器主机名(有意义),并且将每10秒收集一次度量标准。
基本输入配置,例如探针:
[[inputs.cpu]]

[[inputs.mem]]

[[inputs.system]]

[[inputs.disk]]
  mount_points = ["/"]

[[inputs.processes]]

[[inputs.net]]
  fieldpass = [ "bytes_*" ]
要查看所有可用输入,您可以键入:
grep inputs. /etc/telegraf/telegraf.conf.orig
我通常会看一下github repo中的inputs文件夹因为每个输入都有一个README,有助于设置它。
然后输出,这是我们的InfluxDB数据库:
[[outputs.influxdb]]
  database = "telegraf"
  urls = [ "http://127.0.0.1:8086" ]
  username = "telegraf"
  password = "pa$$word"
然后我们可以重新启动telegraf,指标将开始收集并发送到InfluxDB。
service telegraf restart
> use telegraf
Using database telegraf
> SELECT * FROM processes LIMIT 5
name: processes
time                blocked dead host   idle paging running sleeping stopped total total_threads unknown zombies
----                ------- ---- ----   ---- ------ ------- -------- ------- ----- ------------- ------- -------
1522362620000000000 0       0    nagisa 0    0      5       29       0       35    85            0       1
1522362630000000000 1       0    nagisa 0    0      1       30       0       32    82            0       0
1522362640000000000 1       0    nagisa 0    0      1       30       0       32    83            0       0
1522362650000000000 0       0    nagisa 0    0      1       27       0       28    80            0       0
1522362660000000000 0       0    nagisa 0    0      1       27       0       28    80            0       0
您可以使用此命令查看Telegraf收集的内容:
telegraf -test -config /etc/telegraf/telegraf.conf
这在添加新插件时非常有用:
root@server ~# telegraf -test -config /etc/telegraf/telegraf.conf --input-filter cpu
* Plugin: inputs.cpu, Collection 1
* Plugin: inputs.cpu, Collection 2
> cpu,cpu=cpu0,host=server usage_user=1.9999999999527063,usage_system=0,usage_idle=97.99999999813735,usage_iowait=0,usage_steal=0,usage_guest=0,usage_nice=0,usage_irq=0,usage_softirq=0,usage_guest_nice=0 1522576796000000000
> cpu,cpu=cpu-total,host=nagisa usage_steal=0,usage_user=1.9999999999527063,usage_nice=0,usage_irq=0,usage_softirq=0,usage_guest=0,usage_guest_nice=0,usage_system=0,usage_idle=97.99999999813735,usage_iowait=0 1522576796000000000
Grafana安装
Grafana是我们将插入InfluxDB以可视化数据的Web应用程序。
我们将使用他们的APT仓库安装Grafana,如http://docs.grafana.org/installation/debian/中所述。
echo "deb https://packagecloud.io/grafana/stable/debian/ stretch main" > /etc/apt/sources.list.d/grafana.list
curl https://packagecloud.io/gpg.key | sudo apt-key add -
apt install apt-transport-https
apt update
apt install grafana
配置Grafana
默认配置文件/etc/grafana/grafana.ini, 默认设置很好,Grafana将使用SQLite存储其数据。
虽然,这是我建议改变的地方:
http_addr = 127.0.0.1
domain = grafana.domain.tld
enable_gzip = true
root_url = https://grafana.domain.tld
然后我们重新启动Grafana并在启动时启用它:
service grafana-server restart
systemctl enable grafana-server
然后我们将使用配置为反向代理的Nginx通过HTTPS访问Grafana。您可以直接使用HTTPS与Grafana,但我想通过端口443访问它,我已经安装了Nginx,所以..
要生成一个证书,我建议使用acme.sh。
下面是一个服务器配置示例:
server {
        listen 80;
        listen [::]:80;
        server_name grafana.domain.tld;
        return 301 https://grafana.domain.tld$request_uri;

        access_log  /dev/null;
        error_log /dev/null;
}
server {
        listen 443 ssl http2;
        listen [::]:443 ssl http2;
        server_name grafana.domain.tld;

        access_log /var/log/nginx/grafana-access.log;
        error_log  /var/log/nginx/grafana-error.log;

        location / {
                proxy_set_header Host $http_host;
                proxy_set_header X-Real-IP $remote_addr;
                proxy_set_header X-Forwarded-For $proxy_add_x_forwarded_for;
                proxy_set_header X-Forwarded-Proto $scheme;
                proxy_pass http://127.0.0.1:3000;
        }
}
您现在可以使用默认admin/admin凭据登录。
进入后,创建新用户并立即删除管理员用户。
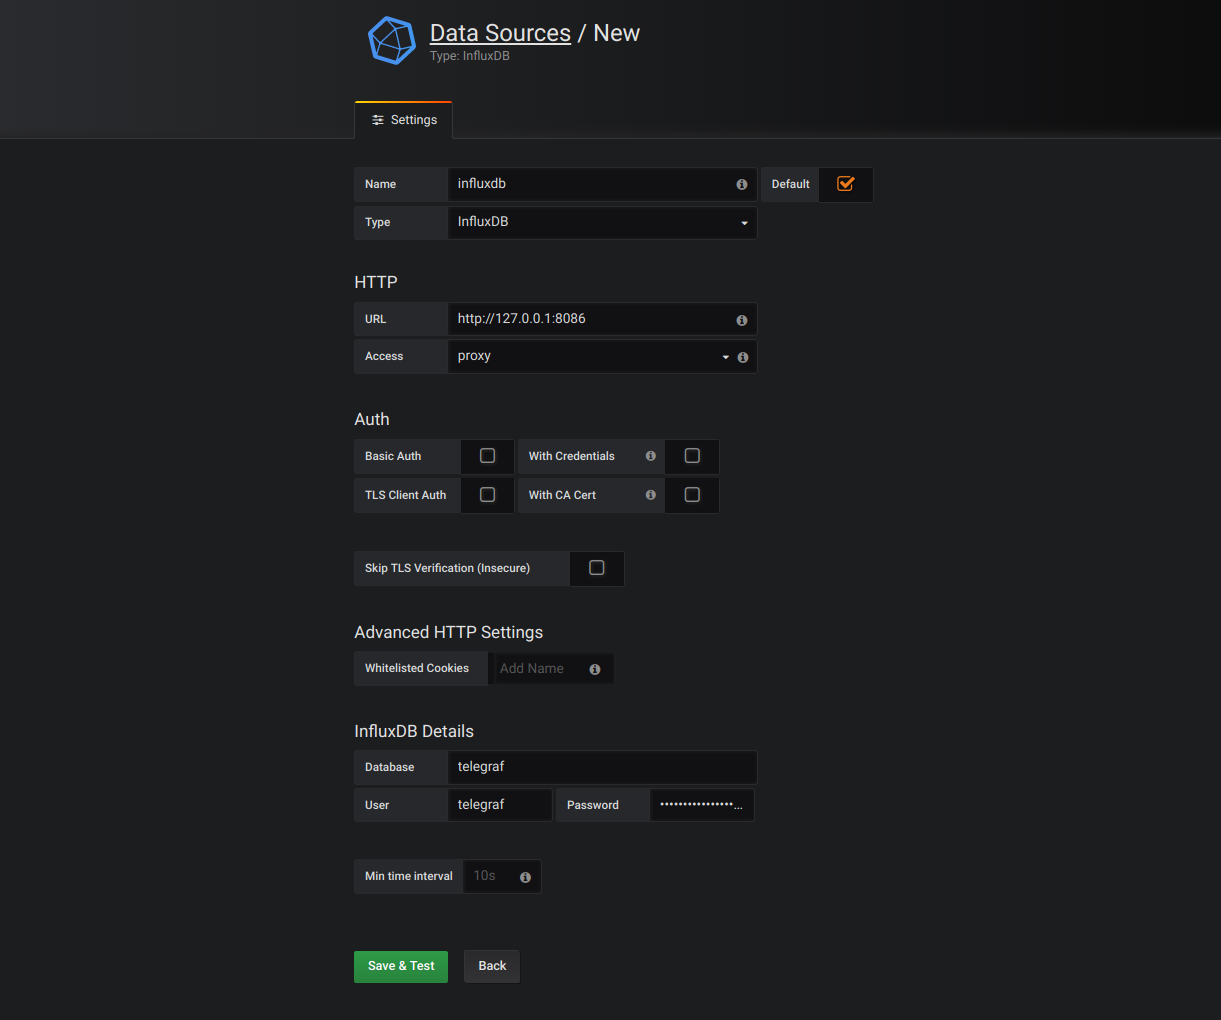
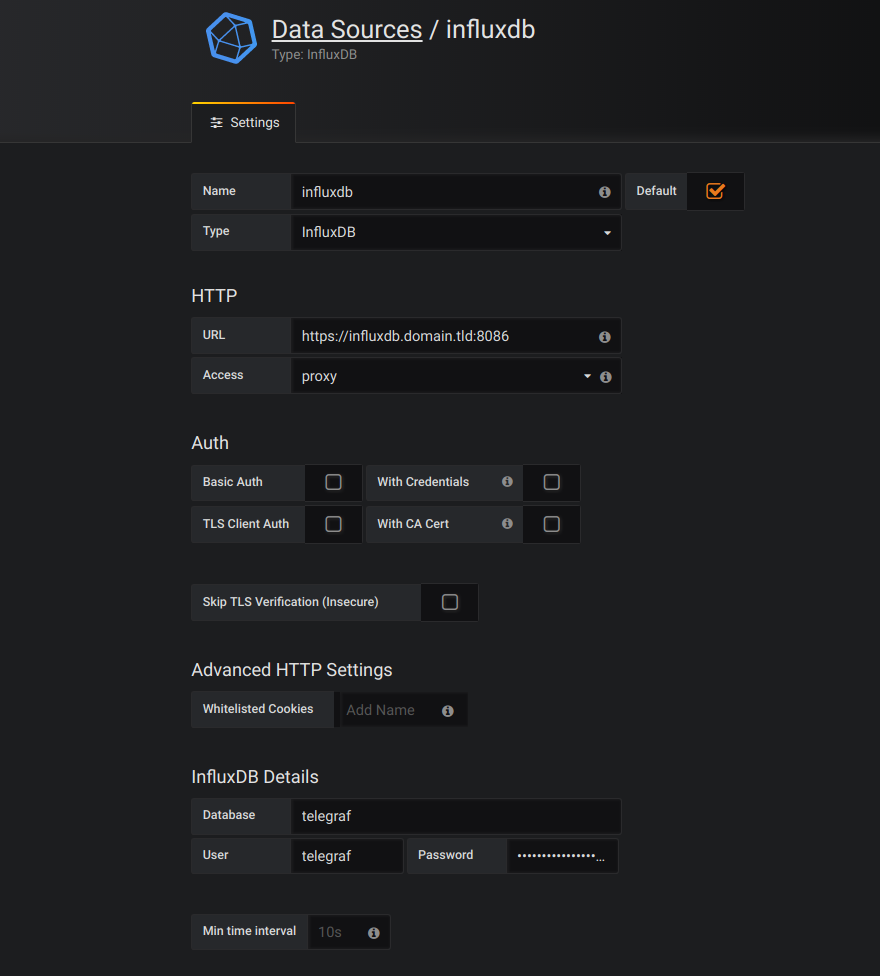
将您的InfluxDB数据库添加为数据源:
Grafana仪表板
您现在可以添加仪表板并开始配置面板。
这里有一个CPU面板示例查询:
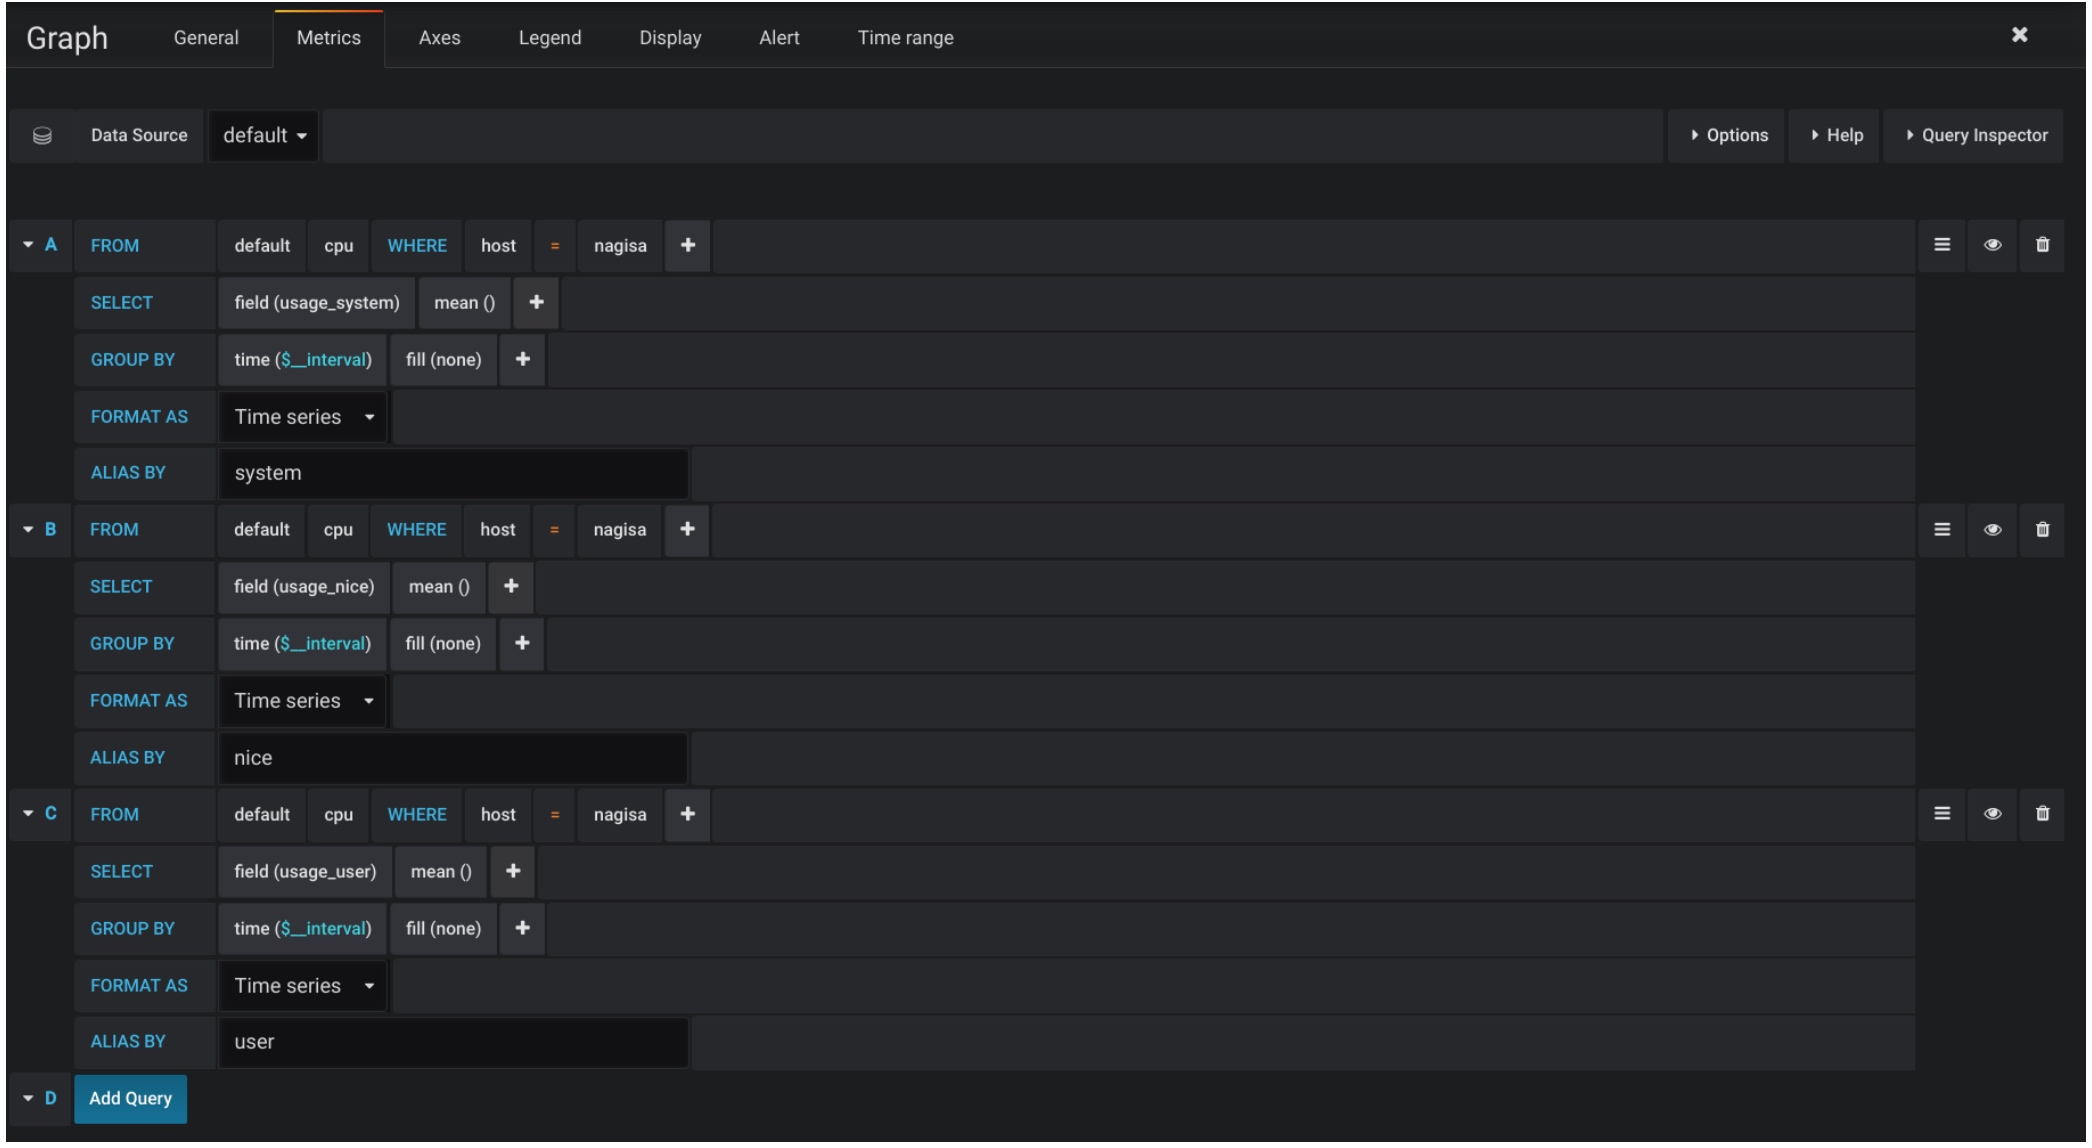
使用测量和图表,您将开始了解它的工作原理。
以下是我的一个仪表板的样子:
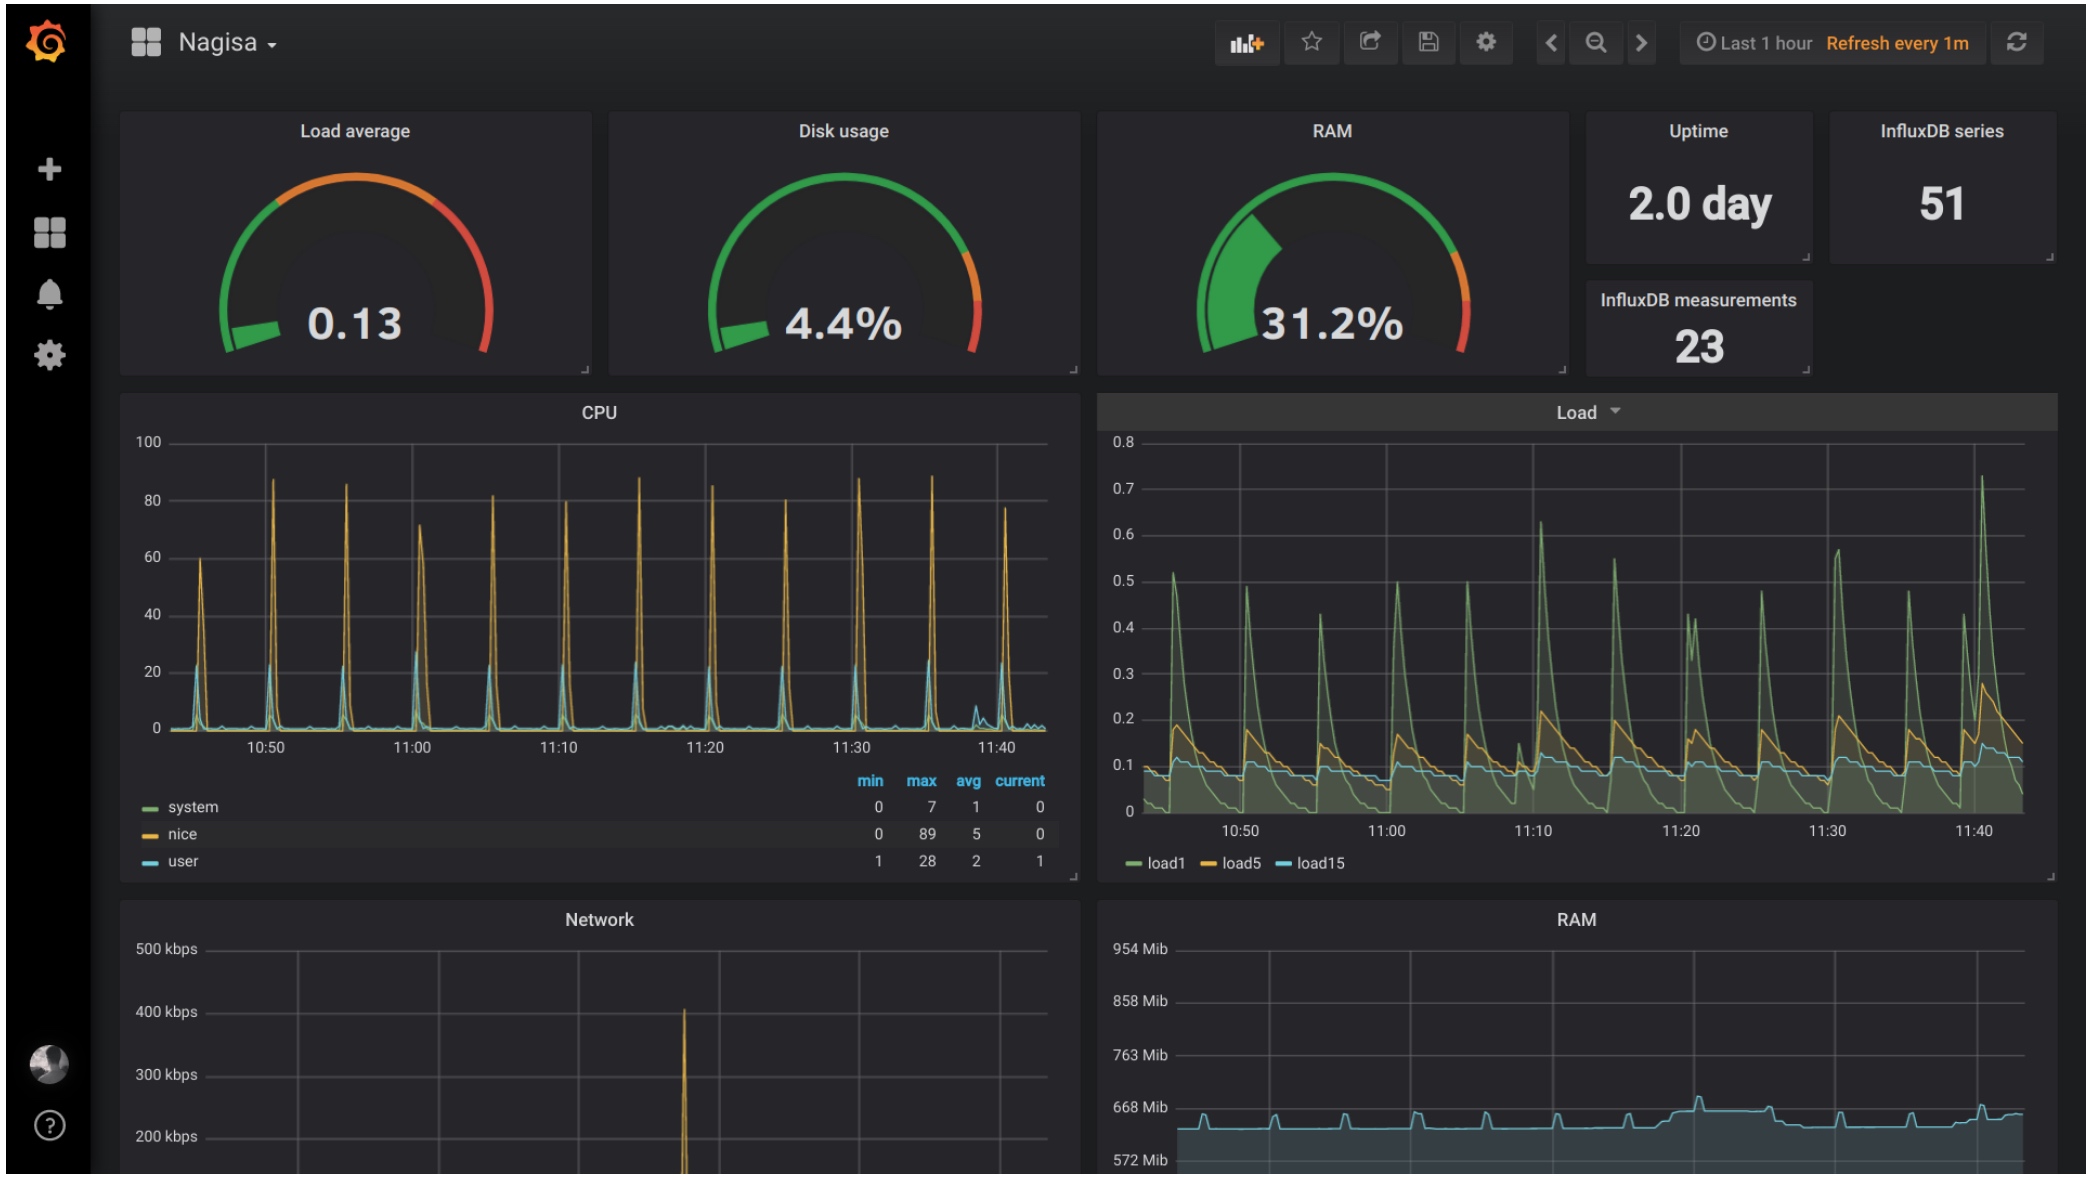
仅供参考,有两种测量方法:
- 那些能告诉你瞬间有多少钱的东西
- 那些显示自上次开始以来$的总金额的那些
这没有意义,所以这里有例子:
- 此时有x个进程
- 自该接口启动以来已传输x个字节
事物是第二种类型将向您显示增加的图形是无意义的,因此您必须在选择查询中添加“转换” -> “衍生”,以便它显示每次测量之间的差异。
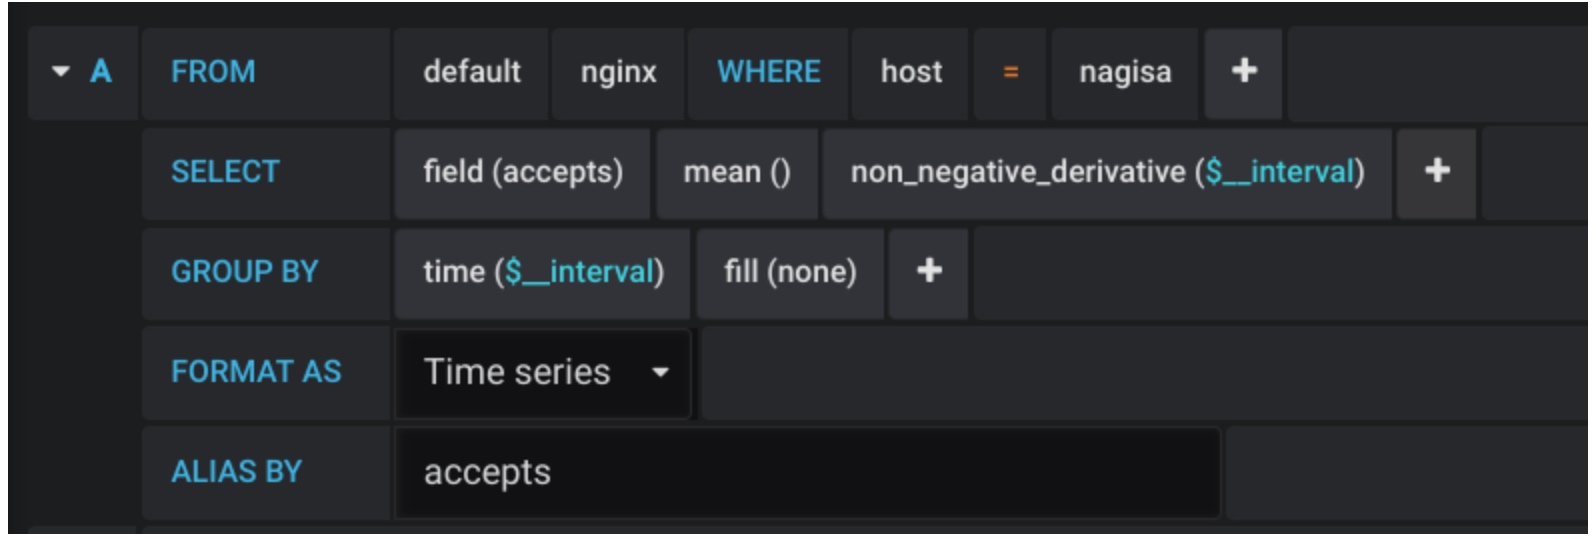
使用Nginx的示例,其中一半指标是第一种类型,另一种是第二种。
root@server ~# curl http://127.0.0.1/status
Active connections: 2
server accepts handled requests
 1192 1192 12255 # First type, use derivative
Reading: 0 Writing: 1 Waiting: 1 # second type, do not use

root@server ~# telegraf -test -config /etc/telegraf/telegraf.conf --input-filter nginx
* Plugin: inputs.nginx, Collection 1
> nginx,port=80,host=server,server=127.0.0.1 handled=1193i,requests=12256i,reading=0i,writing=1i,waiting=1i,active=2i,accepts=1193i 1522576850000000000
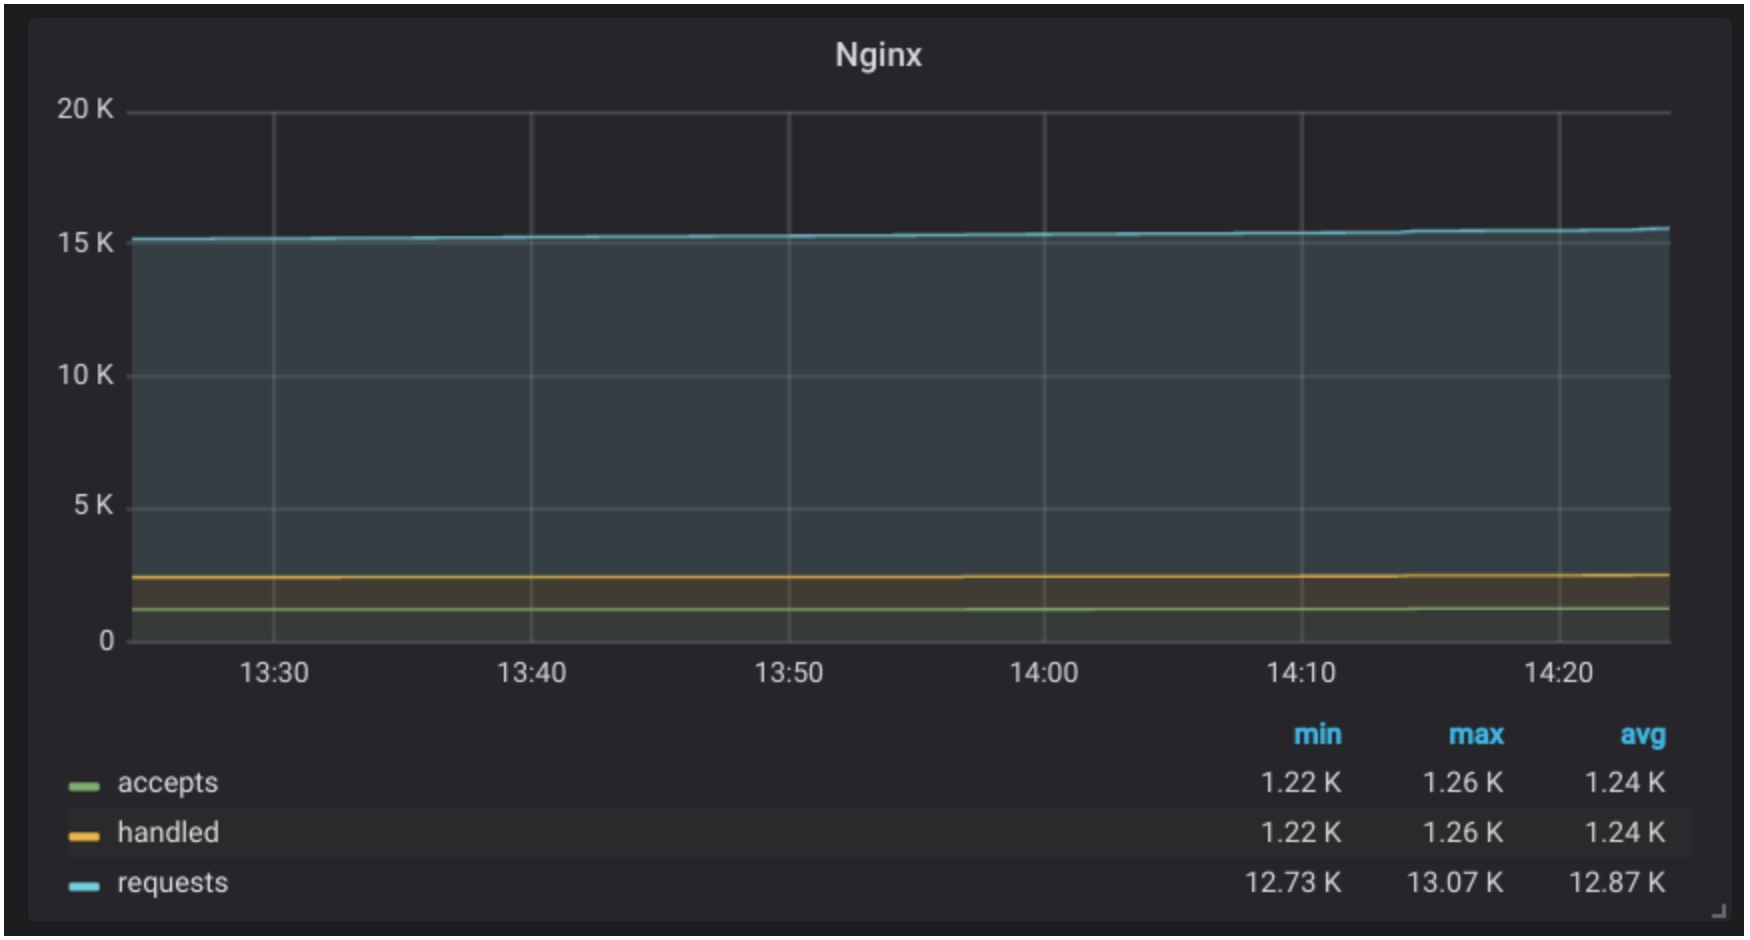
我们以“接受”,“处理”和“请求”为例:
没有导数:
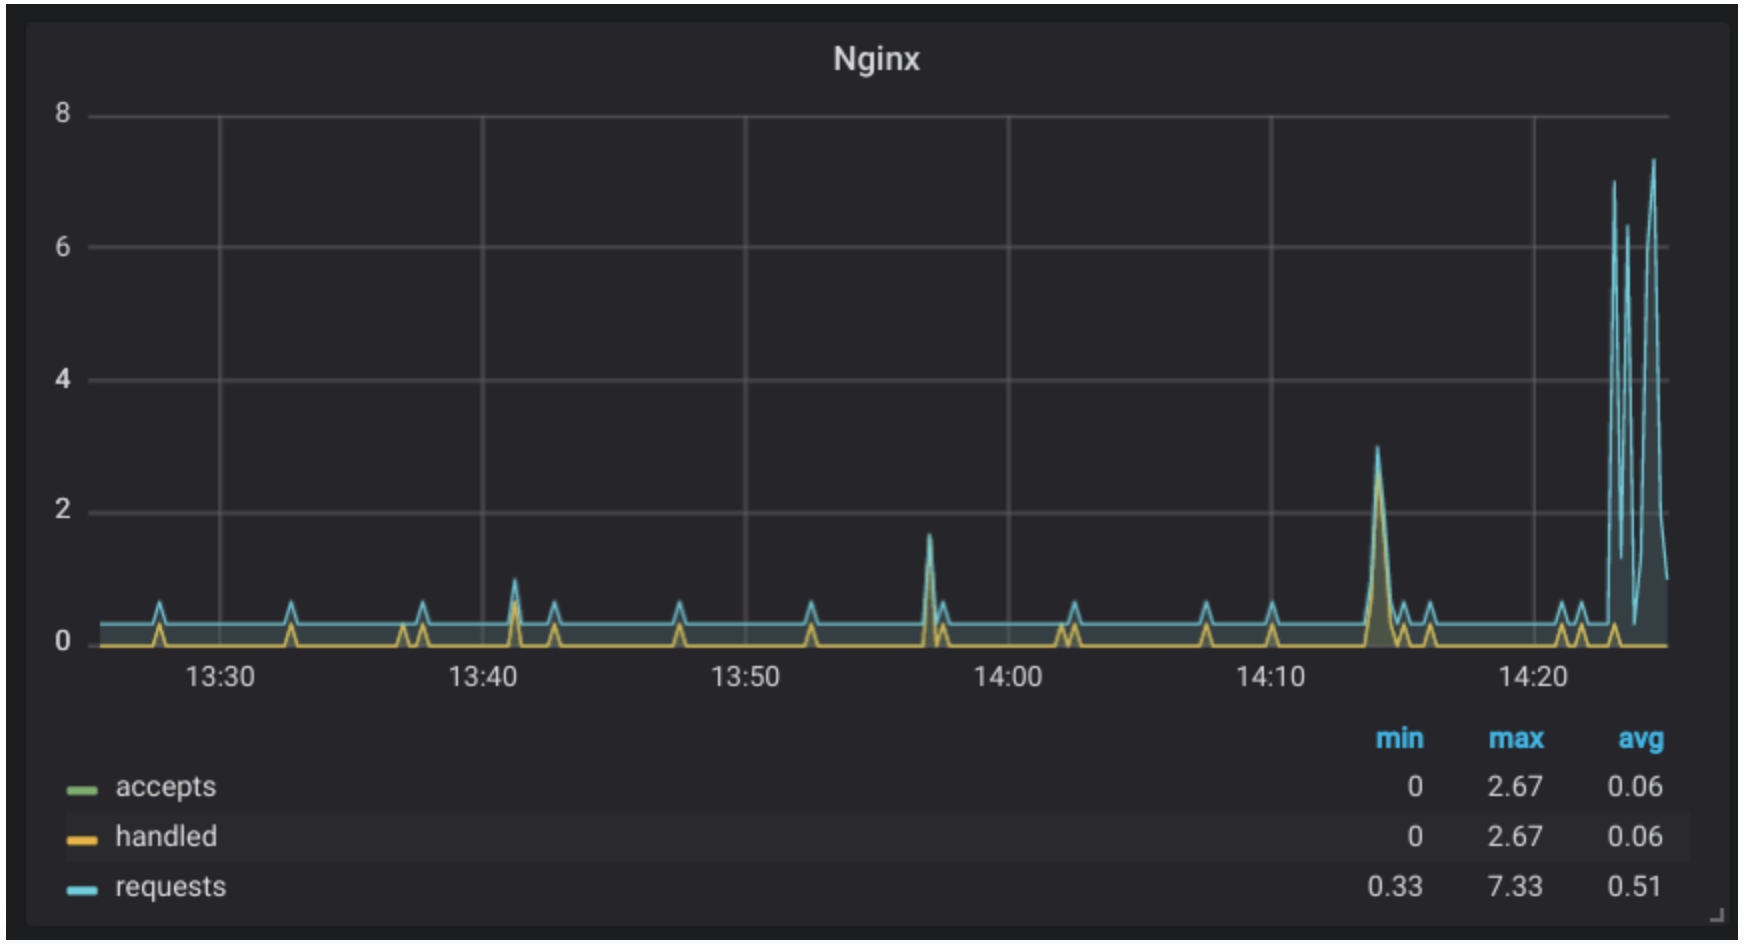
有导数:
关于HTTPS的InfluxDB
所以现在,我们希望监控其他服务器并将数据发送到InfluxDB。为了安全地执行此操作,我们将使用HTTPS,因为InfluxDB通过HTTP进行通信。
仅供参考,不要使用Nginx为InfluxDB做HTTPS。这会弄乱你的数据和数据库。您必须使用InfluxDB的HTTPS实现。
首先,我们想要证书。你可以像使用acme.sh一样使用Grafana。
不要忘记给予InfluxDB阅读权限:
chown influxdb /path/to/cert_and_key
然后启用HTTPS/etc/influxdb/influxdb.conf:
https-enabled = true
https-certificate = "/path/to/domain.tld.fullchain.pem"
https-private-key = "/path/to/domain.tld.key.pem"
重启InfluxDB:
service influxdb restart
现在,我们还不能通过localhost在localhost上使用InfluxDB,你必须修改/etc/telegraf/telegraf.conf:
[[outputs.influxdb]]
  database = "telegraf"
  urls = [ "https://influxdb.domain.tld:8086" ]
  username = "telegraf"
  password = "pa$$word"
在其他监控服务器上使用如上相同的配置。
接下来可以更新Grafana了:
连接influx新的命令如下:
influx -host influxdb.domain.tld -ssl
现在您已准备好添加其他服务器进行监控。为此,只需以完全相同的方式安装和配置Telegraf,并通过HTTPS使用InfluxDB数据库来存储指标。简单!
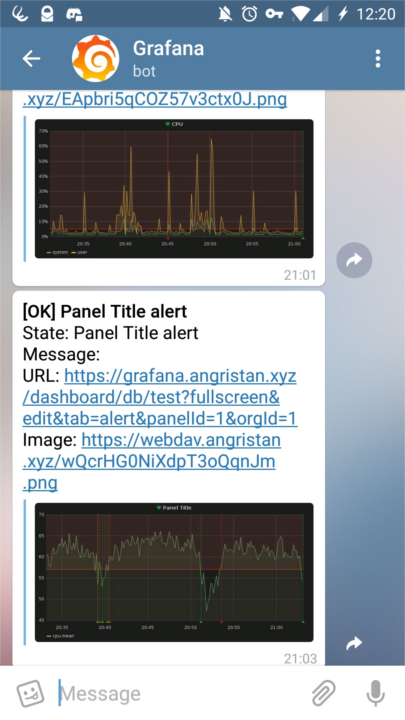
我不介绍这篇文章中的警报,因为它不是特定于堆栈的,你会在网上找到有关如何在Grafana上配置它的资源。几个月前我使用了Telegram和WebDav:
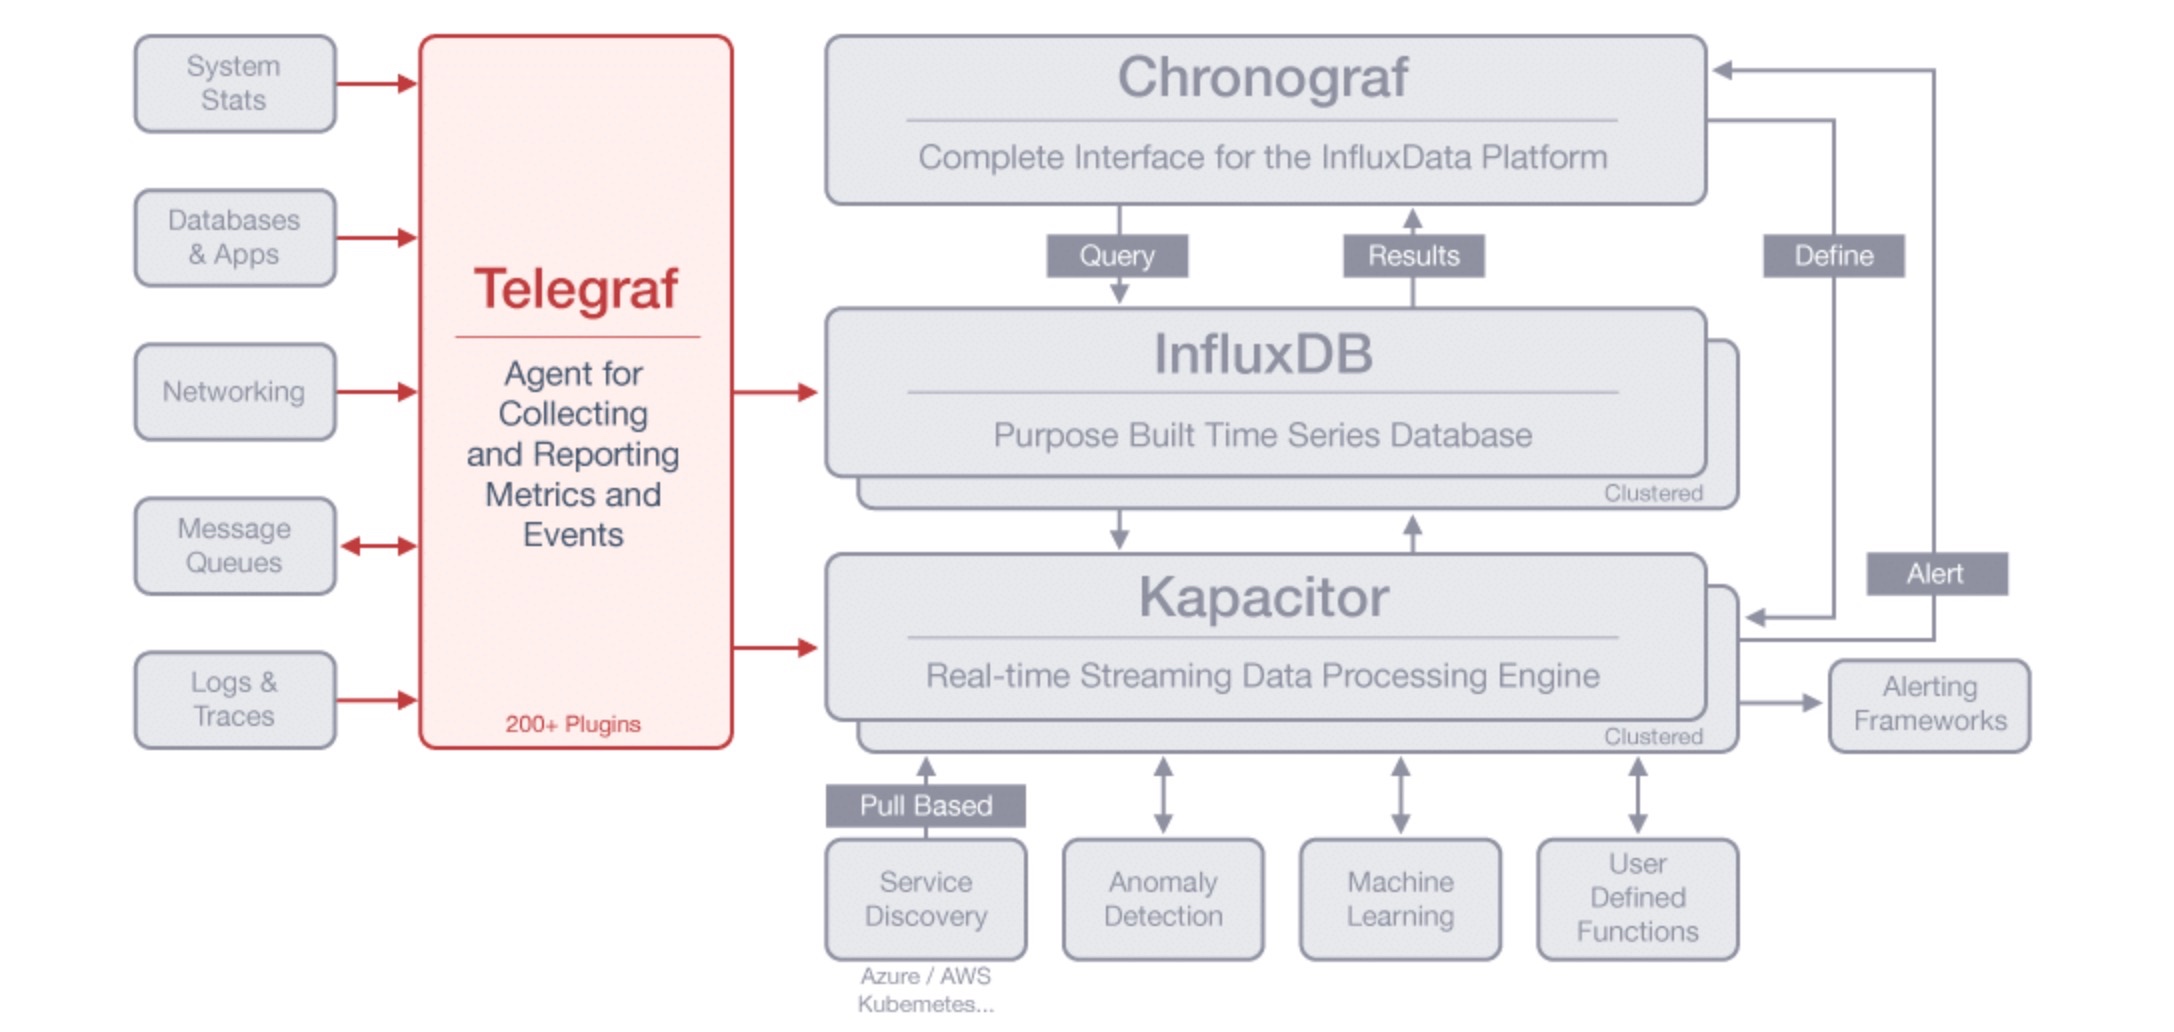
我希望你会发现这篇文章很有用。至于我,我将看看TICK技术栈,看看它与TIG相比的表现如何。
TICK监控栈架构图:
资源链接:
英文原文:http://suo.im/5mykR4

本文由 空心菜 创作,采用 知识共享署名4.0 国际许可协议进行许可
本站文章除注明转载/出处外,均为本站原创或翻译,转载前请务必署名
最后编辑时间为: Aug 27, 2018 at 01:11 pm